TLDR#
- A Python list is an array of pointers. Every int lives in its own separate object somewhere on the heap.
- Shuffling a list only shuffles the pointers. The int objects stay exactly where they are.
- That alone makes a simple loop 4.3x slower on my machine (37.8 ms vs 162.6 ms).
- Most of the slowdown is cache misses from chasing pointers all over memory.
- Branch misprediction is real, but here it accounts for at most about 16% of the gap.
- The fix is unboxed storage with the loop moved out of the interpreter (numpy), not clever ordering.
Introduction#
This post grew out of my lightning talk at PyCon AU 2026. Katie Bell gave it a great response in the follow-up lightning talks on the Saturday. A lightning talk doesn’t leave much room for evidence though, so this is the long version, with the measurements to back it up.
It started with a puzzle: shuffle a list of ints, run the exact same loop over it, and it gets 4x slower. Answering it means asking a question that sounds like trivia: “In Python, how is a list of integers laid out in memory?”
I’ll do this in a couple of parts:
- The puzzle
- How lists and ints are laid out in memory
- The two suspects
- An experiment that separates them
- Proving it on Linux
- What to do about it
The puzzle#
Here’s a very simple function. It adds up every number in a list that’s zero or more:
from random import shuffle

def sum_if_ge_zero(nums: list[int]) -> int:
    total = 0
    for x in nums:
        if 0 <= x:
            total += x
    return total

xs = [x for x in range(-1_000_000, 1_000_001)]
sum_if_ge_zero(xs)   # 37.8 ms

shuffle(xs)
sum_if_ge_zero(xs)   # 162.6 ms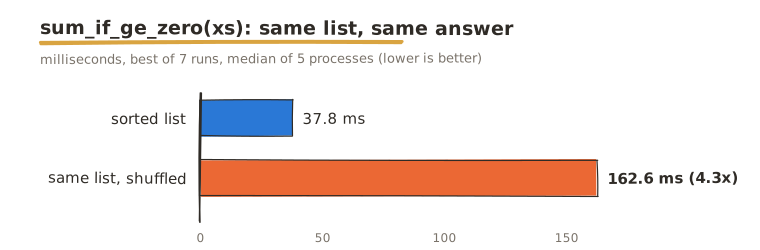
Both calls return the same answer, 500,000,500,000. The second one is 4.3x slower. Why?
Here’s the thing that bugged me. shuffle only reorders the list. It doesn’t create, copy or change a single int object. The loop does exactly the same comparisons and exactly the same additions. The list never moved, so where did 125 ms (62 ns per element) go?
To answer that, we first need to know what a list actually looks like in memory.
My setup#
Every number in this post was measured on one machine, in one session. They only mean something against this profile:
| CPU | Intel Core i9-12900K (Alder Lake), bare metal (systemd-detect-virt: none) |
| Core used | CPU 4, a P-core (Golden Cove), with its SMT sibling left idle, pinned with taskset -c 4 |
| Caches (P-core) | L1d 48 KiB, L2 1.25 MiB, L3 30 MiB shared, 64 B lines |
| Kernel, page size | Linux 7.0.0-42-generic, 4 KiB pages, THP madvise |
| Python | 3.15.2, my own --enable-optimizations --with-lto build with symbols (python3.15-release) |
| Hygiene | performance governor, turbo off (intel_pstate/no_turbo=1, so a flat 3.2 GHz), nmi_watchdog=0, perf_event_paranoid=0 |
Every timed run uses a fresh process and gc.disable(). I take the best of 7 timeit.repeat(number=1) runs, then the median across 5 processes run in alternating order.
How a list of ints is laid out#
The short answer: a list is a small header that points at a separate array of pointers, and every int is its own object somewhere else.
The list object#
A list is a PyListObject. It has five fields: ob_refcnt, ob_type, ob_size, ob_item and allocated. That’s 40 bytes. Lists can end up in reference cycles, so the garbage collector tracks them. That means a 16 byte PyGC_Head (_gc_next and _gc_prev) sits at offsets -16 and -8, in front of the address a name actually points to. This is why sys.getsizeof([]) is 56 and not 40. list.__sizeof__ then adds allocated * 8 for the slots. It never counts the elements themselves.
The int object#
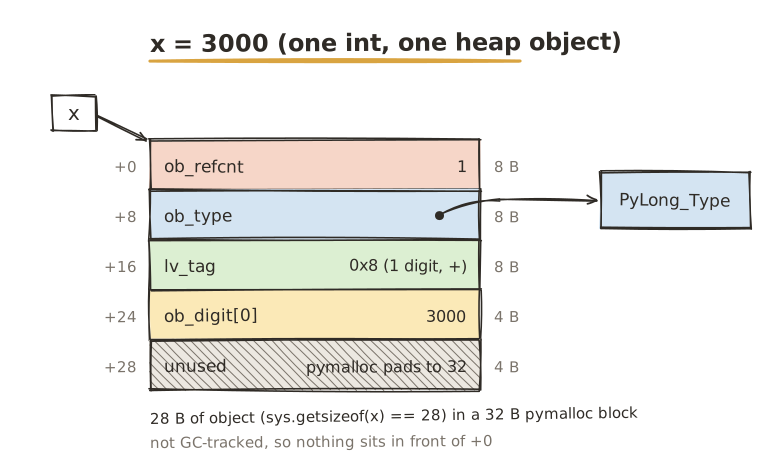
Each int is a PyLongObject: a 24 byte header (ob_refcnt, ob_type, lv_tag) followed by 30-bit digits, stored one per 32-bit word. So a one-digit int reports 28 bytes and lives in a 32 byte pymalloc block, while 2**30 reports 32. lv_tag replaced ob_size back in 3.12. It packs the digit count together with the sign: 3000 is 0x8 (one digit, positive) and -3000 is 0xa. Ints can’t form cycles, so they don’t get a GC header.
Here’s x = 3000:
Two things I would have got wrong#
I checked all of this against the 3.15 source rather than trusting my memory. Luckily, because it corrected two things:
- The small-int cache got bigger. It used to cover -5 to 256. Since gh-133059 (3.15.0a1,
_PY_NSMALLPOSINTS 1025inpycore_runtime_structs.h) it covers -5 to 1024. On my 3.14.4,int("300") is int("300")isFalse. On 3.15 it’sTrue, and 300 is an immortal static object. That’s why the diagrams use 3000 instead. - The growth sequence isn’t 0, 4, 8, 16, 25, 35, 46. That’s the formula from before 3.9. Today’s
new_allocated = (newsize + (newsize >> 3) + 6) & ~3gives0, 4, 8, 16, 24, 32, 40, 52, 64, 76, 92, 108, 128. I confirmed it by appending and watchingsys.getsizeof. When the list grows, the slot array gets realloc’d, but the int objects never move.
The list itself#
Now let’s put it together. Here’s xs, built by five appends. You can see the GC header, the object, the slot array as its own allocation with 3 spare slots, and the int objects scattered wherever pymalloc happened to put them.
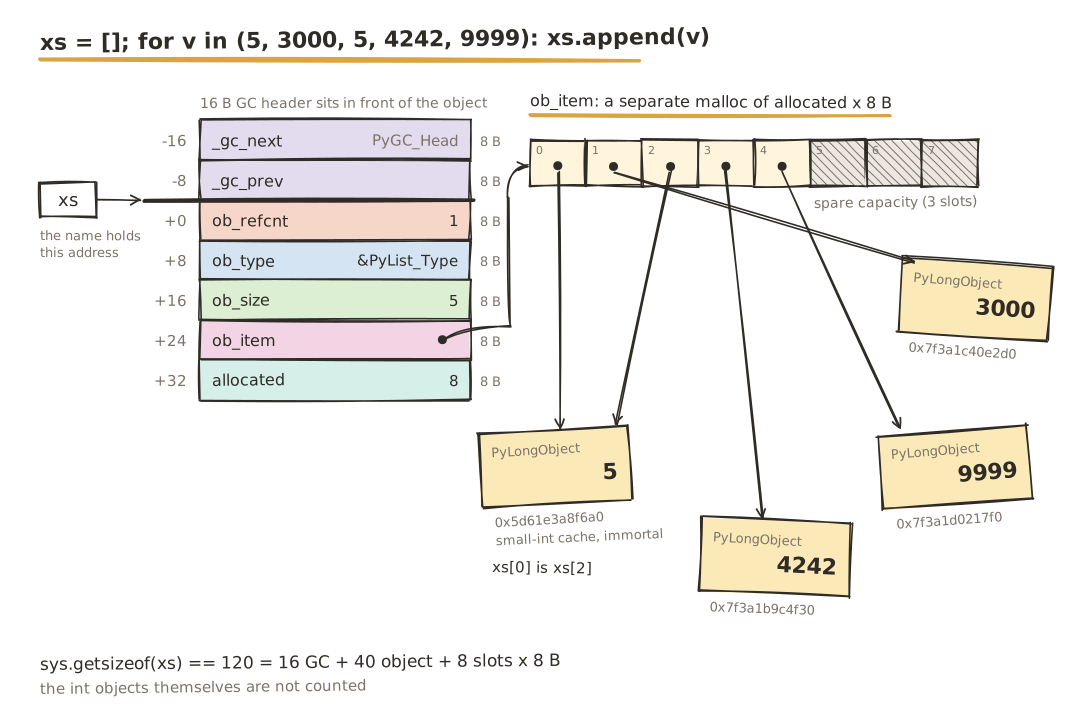
What do we notice here? Slots 0 and 2 hold the same address. 5 comes from the small-int cache, so xs[0] is xs[2]. Built this way, sys.getsizeof(xs) is 120. (Writing it as the literal [5, 3000, 5, 4242, 9999] gives 104, which is 6 slots.)
Compare that with array.array('q') or a NumPy array. Those store the raw 8 byte values in one contiguous buffer. Remember that, it matters later.
Summary so far (checkin)#
So far we’ve:
- seen that a list is a header plus a separate array of pointers
- seen that every int is its own 32 byte object somewhere on the heap
- checked the details against the 3.15 source, which corrected two of them
The two suspects#
Now we can say exactly what shuffle did: it permuted the pointers in the slot array, and nothing else. Every int is still sitting at the same address. So whatever cost us 125 ms is happening below the interpreter, and there are two suspects.
Locality#
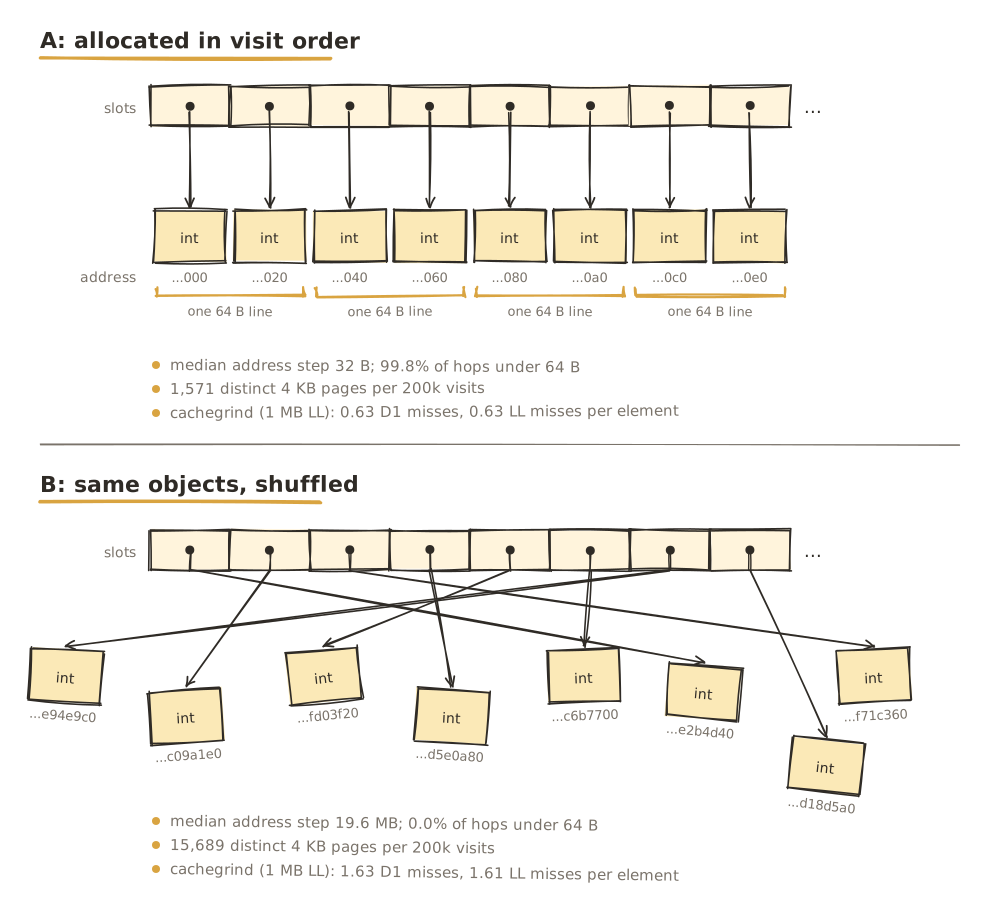
The list comprehension allocated the ints one after another through pymalloc. So index order matches address order, with a 32 byte stride, and the hardware prefetcher can stream them in ahead of time. After the shuffle, every iteration jumps to a random address somewhere in a 64 MB span. That’s a cache miss, and often a TLB miss too.
It’s worse than a plain read. FOR_ITER_LIST does PyStackRef_FromPyObjectNew on each item, which is a read-modify-write of ob_refcnt. So every iteration also dirties a random cache line, and we pay for writing it back later.
Branch prediction#
Sorted, 0 <= x is false a million times and then true a million times. Shuffled, it’s a coin flip. This is the famous “why is processing a sorted array faster?” effect from C. But in Python, every iteration already costs about 19 ns of interpreter work, so I didn’t expect the C folklore to carry over unchanged. My guess was that branches were the smaller term. Let’s find out.
Separating them#
Let’s give each suspect its own variant, so we can test them one at a time. Each variant gets built and timed in its own process. I added a seventh variant (G) along the way:
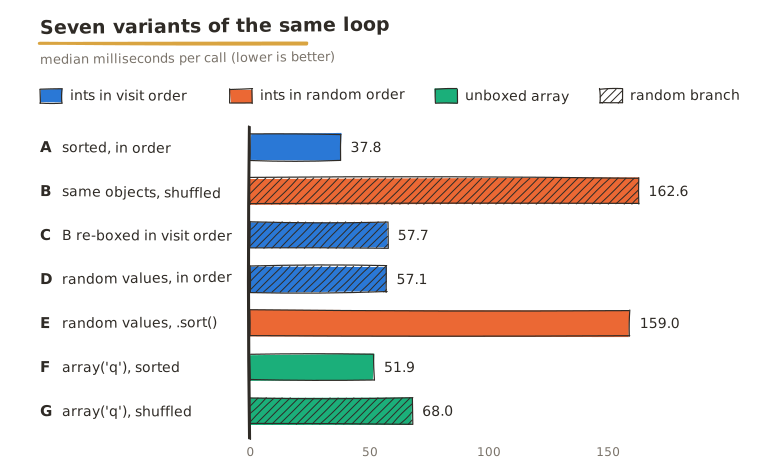
| memory order | branch | median ms | ns/elem | vs A | |
|---|---|---|---|---|---|
| A sorted, allocated in order | sequential | predictable | 37.8 | 18.9 | 1.00 |
| B same objects, shuffled | random | random | 162.6 | 81.3 | 4.30 |
C B re-boxed in visit order, [x - 0 for x in t] | sequential | random | 57.7 | 28.8 | 1.52 |
| D random values, allocated in order | sequential | random | 57.1 | 28.6 | 1.51 |
E random values, then .sort() | random | predictable | 159.0 | 79.5 | 4.20 |
F array('q'), sorted | none | predictable | 51.9 | 25.9 | 1.37 |
G array('q'), shuffled | none | random | 68.0 | 34.0 | 1.80 |
C is the punchline. It has the same values as B, in the same visit order, so it runs the identical branch pattern. The only difference is that the objects are brand new and allocated in visit order. Why does x - 0 give us a new object? BINARY_OP_SUBTRACT_INT computes the result and boxes a fresh int, so it can’t hand back x ((t - 0) is t is False). That one change takes B from 162.6 ms down to 57.7 ms. So about 105 ms of the 125 ms gap is layout.
D (branch only) costs 19 ms over A. E (layout only) costs 121 ms. The two terms nearly add up: 37.8 + 19 + 121 is 178 ms against B’s 163, so they overlap a little.
A layout lesson I learnt the hard way: my first layout measurement checked several variants inside one process, and it reported a 4.7 KB median step for D. In a fresh process, D’s step is a clean 32 B. The earlier variants’ ints had been freed, and pymalloc handed their scattered blocks back out. Layout depends on allocation history, so every variant gets its own process.
The reference run this investigation started from (a 2-core Xeon at 2.1 GHz) had B at 2.2x A. Mine is 4.3x. My ints span 64 MB, against a 30 MB L3, so the cache isn’t hiding anything here. And as we’ll see in a bit, a random walk on this core starts missing L3 well before 30 MB.
Proving it on Linux#
Now this is the part I actually care about. There are four ways to test the locality theory, and I’ll go from cheapest to most involved.
1. A working-set sweep (no privileges needed)#
The idea: keep the branch behaviour the same by putting random values in both arms, and change only the visit order. A cache effect has to switch on as the ints outgrow each cache level. A branch effect can’t do that, because it doesn’t care about size.
Before running anything, I picked sizes from a quarter of L2 up to eight times L3. Each element costs 32 B for the int plus 8 B for its slot, so I predicted the L3 step near N = 30 MiB / 40 B ≈ 790k.
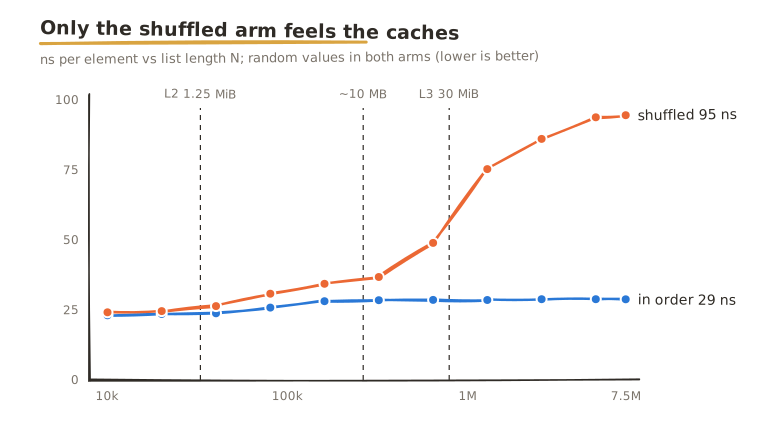
| N | ints MB | in order ns | shuffled ns | ratio |
|---|---|---|---|---|
| 10,000 | 0.31 | 23.1 | 24.2 | 1.05 |
| 40,000 | 1.22 | 23.8 | 26.4 | 1.11 |
| 160,000 | 4.88 | 28.1 | 34.4 | 1.22 |
| 320,000 | 9.77 | 28.5 | 36.8 | 1.29 |
| 640,000 | 19.53 | 28.6 | 49.0 | 1.71 |
| 1,280,000 | 39.06 | 28.6 | 75.3 | 2.64 |
| 2,560,000 | 78.12 | 28.8 | 86.1 | 2.98 |
| 7,500,000 | 228.88 | 28.8 | 94.6 | 3.28 |
The in-order arm sits at 28.5 to 28.8 ns from 160k upwards. That flat line is the interpreter floor, and it’s the real evidence here. (The smallest sizes run a little faster, which I didn’t chase down.) The shuffled arm steps up slightly around the L2 size, then sharply between 320k and 1.28M.
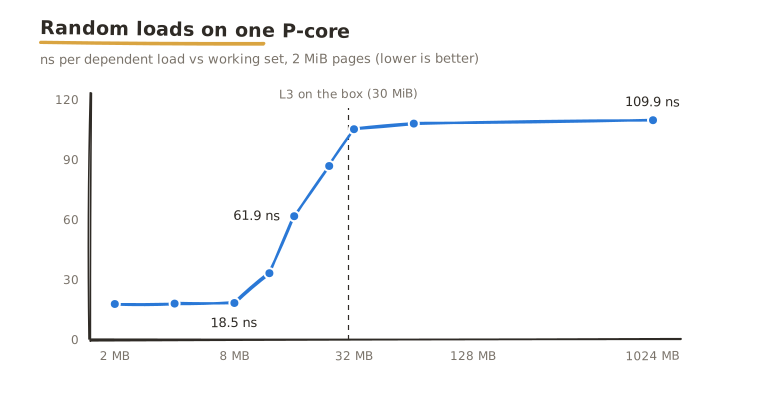
That’s earlier than the 790k I predicted. Well, a small C pointer-chase program (pinned, on 2 MiB pages) explains why. Random loads on this core average 18.5 ns at 8 MB, 33 ns at 12 MB, 62 ns at 16 MB and 105 ns at 32 MB. So for random access, the effective L3 is closer to 10 MB than the 30 MB on the box. I found no cache partitioning (/sys/fs/resctrl doesn’t exist), and I didn’t pin down the cause.
2. Check the premise with id()#
In CPython, id() is the object’s address, so we can look at the layout directly:
| median step | hops < 64 B | 4 KB pages per 200k visits | |
|---|---|---|---|
| A | 32 B | 99.8% | 1,571 |
| B | 19.6 MB | 0.0% | 15,689 |
| C | 32 B | 99.7% | 1,578 |
The page count is the TLB story. 200k sequential visits stay inside about 1,600 pages. 200k shuffled visits touch nearly all of the roughly 16k pages the list spans.
3. Cachegrind, as a cross-check#
Cachegrind simulates the caches, so it doesn’t need hardware counters. That makes it the fallback if you’re on a VM. I ran each variant at 1 pass and at 5 passes, then took (counts@5 - counts@1) / 4. That cancels out startup, list building and the shuffle itself.
The real geometry is a 48 KiB 12-way D1 and a 30 MiB LL. Cachegrind wants a power-of-two number of sets, so I modelled the LL as 15-way. I also ran a deliberately small 1 MiB LL:
valgrind --tool=cachegrind --cache-sim=yes --D1=49152,12,64 --LL=31457280,15,64 python3 ...
valgrind --tool=cachegrind --cache-sim=yes --D1=32768,8,64 --LL=1048576,16,64 python3 ...| per element | Ir | Dr + Dw | D1 misses | LL misses (30 MiB) | LL misses (1 MiB) |
|---|---|---|---|---|---|
| A | 346.2 | 128.9 | 0.63 | 0.63 | 0.63 |
| B | 349.9 | 130.0 | 1.63 | 1.14 | 1.61 |
| C | 349.9 | 130.0 | 0.63 | 0.63 | 0.63 |
B and C execute the same number of instructions and data references, and C misses exactly like A. A’s 0.63 is right at the floor you’d expect: two 32 byte ints share each 64 byte line (0.5 misses), plus 8 bytes of slot array per element (0.125). Keep in mind that cachegrind models neither the prefetcher nor the TLB, so it understates the real gap.
4. perf (the main event)#
This is real hardware, so the performance counters are the best tool we have. One trick makes them much easier to read. The benchmark turns counting on and off around the loop itself through perf’s control FIFO (perf stat --control fifo:ctl,ack -D -1), so building and shuffling the list never get counted. Each run below covers 5 passes over 2,000,001 elements, repeated 5 times.
Top-down#
Top-down analysis answers the whole question in one command. It sorts every pipeline slot into Retiring (useful work), Bad Speculation, Frontend Bound or Backend Bound:
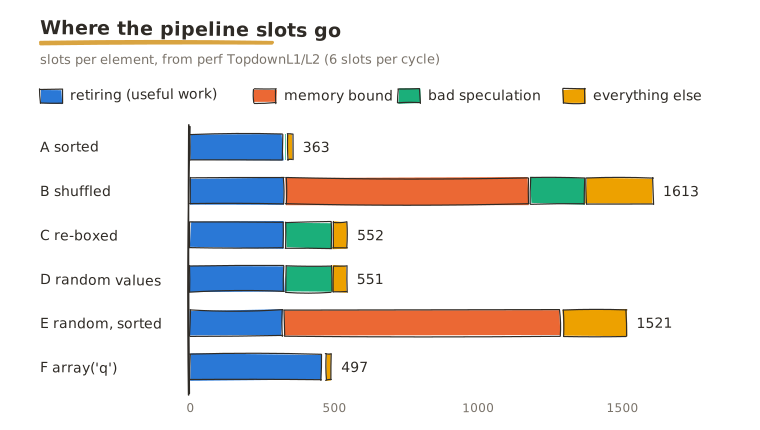
perf stat --cputype core -M TopdownL1,TopdownL2 -r 5 taskset -c 4 python3 ...| % of slots | A | B | C | D | E | F |
|---|---|---|---|---|---|---|
| Retiring | 90.3 | 20.6 | 59.9 | 60.2 | 21.5 | 93.2 |
| Bad speculation | 2.6 | 12.0 | 29.8 | 29.8 | 0.4 | 0.8 |
| Backend bound | 2.7 | 64.7 | 3.2 | 3.1 | 76.9 | 1.8 |
| of which memory bound | 0.4 | 52.6 | 0.4 | 0.4 | 63.3 | 0.8 |
| Total slots (G) | 3.63 | 16.13 | 5.52 | 5.51 | 15.21 | 4.97 |
This is my favourite table in the post. The branch-only variants (C and D) move Bad Speculation, and Memory Bound stays at 0.4%. The layout-only variant (E) moves Memory Bound, and Bad Speculation stays at 0.4%. B has both, and most of its time goes into Memory Bound: 8.5 G slots, against 1.9 G for bad speculation.
Raw counters#
Next, the raw numbers, per element:
| per element | A | B | C | E |
|---|---|---|---|---|
| instructions | 344.9 | 348.7 | 348.7 | 345.4 |
| cycles | 60.4 | 260.8 | 92.0 | 252.8 |
| IPC | 5.71 | 1.34 | 3.79 | 1.37 |
| branch-misses | 0.000 | 0.529 | 0.506 | 0.001 |
| LLC-load-misses | 0.000 | 0.971 | 0.002 | 1.038 |
| dTLB walks completed | 0.000 | 0.763 | 0.000 | 0.792 |
| cycles stalled on an L3 miss | 0.1 | 136.9 | 0.4 | 155.8 |
Let’s read it in order:
- Instructions are within 1.1% between A and B. B isn’t doing any extra work.
- Cycles go up 4.3x and IPC drops from 5.7 to 1.3. B is stalling.
- B costs 200.4 more cycles per element than A. At 3.2 GHz that’s 62.6 ns.
Now we can check which suspect accounts for those 62.6 ns:
- Branches. 0.53 extra mispredicts at the textbook 15 to 20 cycles each is 8 to 11 cycles, about 5% of the gap. The measured cost is bigger: C over A is 31.6 cycles for 0.506 mispredicts, about 62 cycles each. That kind of makes sense, since a mispredict throws away a whole reorder buffer full of interpreter work. Even so, branches account for 16% of the gap at most.
- Memory. 0.97 extra LLC misses at 108 ns each (what my pointer chase measured for DRAM) comes to 105 ns. That’s more than the whole 62.6 ns gap. So the misses must overlap. And they can, because the next address comes from the slot array, not from the int we just loaded. On average about 1.7 are in flight at once. The stall counter agrees: 137 of the 200 extra cycles are spent waiting on an L3 miss.
Which load is it?#
Finally, let’s find the exact instruction that misses:
perf record -e cpu_core/mem_load_retired.l3_miss/pp taskset -c 4 python3 ...
perf annotate -s _PyEval_EvalFrameDefault
98.2% of the L3-miss samples land in _PyEval_EvalFrameDefault. Within it, 64% fall on a single instruction:
         : next = PyStackRef_FromPyObjectNew(PyList_GET_ITEM(list_o, ...));
         : return _Py_CAST(int32_t, op->ob_refcnt) < 0;      // _Py_IsImmortal
   64.15 :   mov    (%rdx),%ecx
That’s the very first time we touch the int: the immortality check inside Py_INCREF, in FOR_ITER_LIST. Right after it comes add $0x1,%ecx; mov %ecx,(%rdx), the read-modify-write from earlier. The other 35% are the lv_tag and ob_digit[0] loads in COMPARE_OP_INT. None of the samples are on the slot array.
Things that should move the needle#
If locality really is the cause, a few interventions should change the numbers.
Turning off the prefetchers. This would be the sharpest test of all: with the prefetchers off, the sorted case should collapse towards the shuffled one. On Intel, that means reading MSR 0x1a4 with rdmsr, writing that value OR 0xf, and restoring it afterwards. I wrote down the restore command first (wrmsr -p 4 0x1a4 0x0, the value I read). It didn’t work. My machine boots with Secure Boot, which puts the kernel in lockdown integrity mode, and every wrmsr came back with Operation not permitted (dmesg says “raw MSR access is restricted”). I wasn’t going to turn off Secure Boot for a blog post, so I don’t have a number for this one. (On AMD Zen the register is 0xc0000108. ARM doesn’t expose a control like this to software.)
Huge pages. echo always > .../transparent_hugepage/enabled did nothing at all: a process holding list B had 0 MB of AnonHugePages. pymalloc maps its 1 MiB arenas one at a time, so at page-fault time there’s never a whole 2 MiB-aligned range for the kernel to back. What did work, without root, was routing allocations through glibc, which can madvise its heap. Setting PYTHONMALLOC=malloc and GLIBC_TUNABLES=glibc.malloc.hugetlb=1 put 98 MB into huge pages. For B, page walks dropped from 0.79 per element to effectively zero, and cycles dropped from 283 to 258 per element. Wall time across three alternating runs went from 175.7 to 180.4 ms down to 162.3 to 173.2 ms. So the TLB matters, but it’s about a tenth of the cost. The cache misses are still there.
Unboxed storage. That’s F and G in the table. With array('q'), the order no longer affects memory at all, and the remaining 16 ms between F and G is purely the branch. You might be surprised that F is slower than A. Iterating an array boxes a fresh int on every step (485 instructions per element, against A’s 345). So unboxed storage on its own doesn’t help if the loop stays in Python.
Measurement hygiene#
A few things that kept these numbers honest:
- Pin to one P-core and use the performance governor, with turbo off
- Run each variant in a fresh process, and alternate the order to cancel out drift
- Use
setarch -Rwhen you need reproducible addresses - Never let
shufflesit inside the measured region - On a hybrid CPU, use
cpu_core/events or--cputype core. Otherwise perf reports separatecpu_coreandcpu_atomrows and multiplexes them
What to do about it#
At its heart this is a boxing problem. A list of ints is a list of pointers to separate objects, and the cost of the shuffled loop is the cost of chasing them. You could restore locality by re-boxing in visit order, like variant C did, but that’s fragile cleverness. The real fix is unboxed storage, with the loop moved out of the interpreter. Let’s give that a try with numpy:
| numpy 2.5.4, 2,000,001 int64 | sorted ms | shuffled ms |
|---|---|---|
a[a >= 0].sum() | 1.73 | 12.46 |
np.where(a >= 0, a, 0).sum() | 2.42 | 10.64 |
np.maximum(a, 0).sum() | 1.71 | 1.69 |
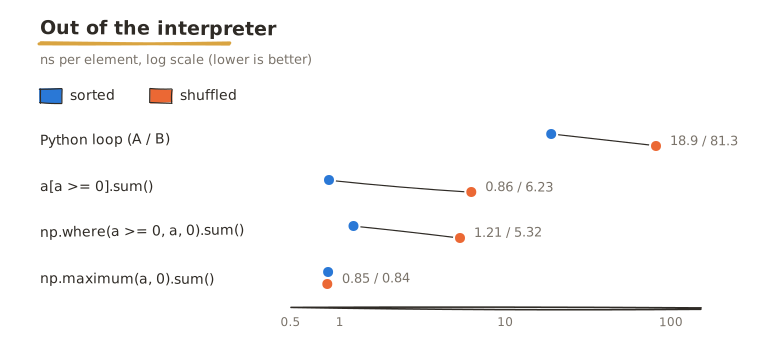
np.maximum(a, 0).sum() takes 0.85 ns per element, whatever the order. That’s 22x faster than the best Python loop and 96x faster than the shuffled one.
The table also brings the C folklore back. Once the interpreter’s 19 ns per element is gone, the branchy versions get 5 to 7x slower on shuffled data, exactly as the sorted-array story predicts. In Python, branch prediction is real but secondary. Once each element costs about a nanosecond, it matters again.
Conclusion#
We’ve covered a lot. I hope you now have a feel for how a Python list actually sits in memory, and why “the same work” isn’t the same cost once the CPU has to go looking for it. You won’t need any of this most days. But the next time a loop is mysteriously slow, I’d suggest asking where its objects live before asking what the loop does.