Everyone who writes Python for a living has been handed the same rule: don’t use a list, use an array.
It’s a good rule. I’ve given it as advice myself, probably to someone who deserved a better explanation than
the one I gave.
Here is the rule being followed, on two million integers:
sum(values)             # a plain list       10.0 ms
sum(values)             # array('q')         19.2 ms
Swapping the list for a compact array of machine integers made it twice as slow. Nothing was measured wrongly. That is what the machine does.
And here is the same list, containing the same two million objects, summed twice:
sum(ordered)            # 10.0 ms
sum(shuffled)           # 74.9 ms
Same objects. Same length. Same additions, in a different order. Seven and a half times slower.
Neither of those is explained by “interpreters are slow”. Both are explained by the same thing, and it is the subject of this post: what it costs when the machine has to find out where your data is before it can go and get it.
Part one was about how much memory arrives per fetch, and part three was about who owns it. This one is about a cost neither of them touched, which is that a load can’t start until its address is known, and if that address is sitting in memory you haven’t fetched yet, the core has nothing to do but wait.
The same objects, in a different order#
Start with the shuffle, because it is the cleanest control I have.
BASE = 1 << 40
ordered = [BASE + i for i in range(2_000_000)]
shuffled = list(ordered)
random.shuffle(shuffled)
shuffled is not a copy of the data. It is a copy of the pointers. Both lists contain exactly the same
two million integer objects, at exactly the same addresses; the only difference is the order the slots are
in. Same object count, same list length, same bytecode, same arithmetic.
# for loop, body is `total += 1`
#   ordered      20.9 ms
#   shuffled    124.4 ms      6.0x

# sum()
#   ordered      10.0 ms
#   shuffled     74.9 ms      7.5x
Look at the loop first, because it is the stranger of the two. Its body is total += 1. It never reads the
integers at all. And it is still six times slower on the shuffled list.
The reason is that CPython cannot walk past an object without touching it. Binding the loop variable increments a reference count, and dropping it decrements one again, and that counter lives in the first few bytes of the object itself. So a loop that ignores your data entirely still performs a read-modify-write on every object in the list. When those objects are scattered, each of those writes is a trip to memory.
Then notice which way the ratio moves. Going from the for loop to sum() cuts the interpreter’s
per-element work substantially — and the gap gets wider, from 6.0× to 7.5×. If the interpreter were what we
were measuring, removing interpreter overhead would shrink the difference. It grows, because the fixed cost
of waiting for memory is now a larger share of a smaller total.
One warning, because this benchmark is easy to get wrong in a way that shows you nothing:
small = [i % 200 for i in range(2_000_000)]
# for loop, ordered      19.9 ms
# for loop, shuffled     19.6 ms      1.0x
# distinct objects       200 for 2,000,000 slots
The effect vanishes completely. CPython preallocates every integer from −5 to 256 as a singleton, so a list
of small numbers is two million pointers to the same two hundred objects, all of them hot in L1 and none of
them scattered anywhere.1 There is nothing to chase. If you reproduce this experiment with range(100)
you will measure nothing and conclude, reasonably enough, that I made it up.
What a list actually is#
A Python list is a contiguous array of pointers. That part is genuinely good: the pointers themselves sit
side by side and stream nicely.
What they point at is the problem. Each integer is a separate heap object, and on this machine:
sys.getsizeof(1 << 40)      # 32 bytes
# most common stride         48 bytes
# address span             1152 MB for 2,000,000 objects
# pointer array              17 MB
Thirty-two bytes to hold eight bytes of number. Consecutive integers usually land 48 bytes apart, because CPython’s allocator hands out fixed-size blocks and other allocations get interleaved between yours. And the whole set is smeared across a gigabyte of address space, because the allocator takes arenas from the kernel wherever the kernel feels like putting them.
So walking the list in allocation order is a mostly-ascending walk through a gigabyte of memory in dense little runs, which the prefetcher copes with rather well. Walking it shuffled is two million independent random hits across that same gigabyte, and the prefetcher can do nothing at all.
That accounts for the 7.5×. It does not account for the array('q') result, and we’ll need to go somewhere
else to get that.
The same shape without an interpreter#
To see the mechanism I need the interpreter out of the way, so here is the same set of shapes in Rust. Every
variant sums the same four million u64 values and asserts the same total. The only thing that changes is
how it reaches them.
#[repr(C)]
pub struct Node {
    pub value: u64,
    pub next: *const Node,
}
Four million of these are allocated one at a time, in order, exactly the way an interpreter allocates boxed integers as it fills a list. Then three different routes through them:
- boxed, ordered — walk the nodes in allocation order.
- boxed, shuffled — walk them through a shuffled array of pointers, which is the Python
listshape. - list chase — walk them by following each node’s
nextfield.
The shuffled walk and the chase visit the same nodes in the same order. I build one permutation and use it
for both: the array of pointers holds it explicitly, and the next fields encode it.2 Nothing differs
except where the address comes from.3
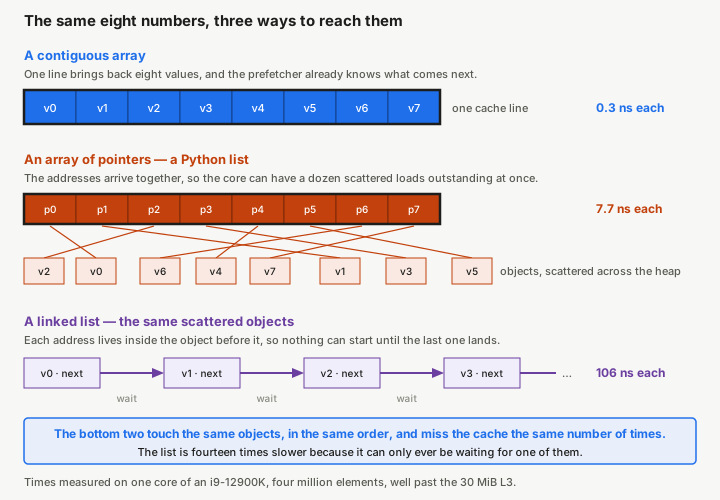
contiguous            0.30 ns/element
boxed, ordered        1.55 ns/element
boxed, shuffled       7.62 ns/element
list chase          106.23 ns/element
The first three are roughly what part one would lead you to expect: contiguous beats indirection, and indirection with locality beats indirection without it. A factor of twenty-five from top to bottom, all of it a locality story.
Then the chase, which is fourteen times slower again than the shuffled walk, over the same objects, in the same order. Locality cannot explain that, because the locality is identical. Something else is going on, and part one has no vocabulary for it.
Scattered is only half of it#
Here’s the experiment that isolates it. Forget objects; take one flat array of eight-byte integers, where each slot holds the index of the slot to visit next. Now sum every element, twice:
// independent: the indices arrive from a separate array
for &i in &order {
    total += data[i as usize];
}

// dependent: each index comes out of the slot before it
let mut i = start;
for _ in 0..data.len() {
    let next = data[i];
    total += next;
    i = next as usize;
}
These touch identical addresses in identical order and produce an identical total. The loops execute essentially the same number of instructions. The only difference in the entire experiment is whether the next address is already in a register or still somewhere in DRAM.
gather, independent    3.95 ns/element
gather, dependent     62.34 ns/element
Nearly sixteen times, for knowing the address early.
And it is worth being precise about how little else differs, because this is exactly the sort of result that turns out to be an artefact if you don’t check:
                        L3 misses    TLB walks
                      per element  per element
gather, independent         0.324       0.7818
gather, dependent           0.487       0.7832
Page walks are identical to four significant figures, so it isn’t the TLB. Cache misses are within a small factor and, if anything, the independent version is doing more total memory traffic, since it streams a whole extra array of indices alongside the data. It misses the cache about as often and it’s sixteen times faster.
Sixteen at once, or one#
The reason is that a modern core does not fetch one cache line at a time. It has a set of buffers — Golden Cove has sixteen of them — that each track one outstanding L1 miss, and it will happily start all sixteen before the first one comes back. Memory latency is roughly 80 nanoseconds around here and doesn’t improve just because you asked politely, but if you have sixteen requests in the air at once you get sixteen lines per 80 nanoseconds instead of one. That capacity is called memory-level parallelism, and out-of-order execution exists in large part to find enough independent work to use it.
You can measure how much of it a loop actually gets. l1d_pend_miss.pending counts outstanding misses
summed over cycles, and l1d_pend_miss.pending_cycles counts cycles where at least one was outstanding.
Divide one by the other and you have the average number of misses in flight whenever the core was waiting:
                      ns/element    IPC    MLP   fill buffers full
contiguous                  0.30   1.14   6.58                12 %
boxed, ordered              1.55   0.30  12.51                81 %
boxed, shuffled             7.62   0.06  12.83                83 %
list chase                106.23   0.01   0.99                 0 %
gather, independent         3.95   0.35  10.81                62 %
gather, dependent          62.34   0.02   1.00                 0 %
There it is, and it is about as blunt as hardware ever gets. Every variant that can run ahead is sitting between 6 and 13 misses in flight, with the fill buffers completely full for 60–80% of cycles — those loops are limited by the number of requests the core can track. Both dependent variants measure 1.00. Not approximately one. One. The core never has a second thing to ask for, because the only way to learn the next address is to finish the current load.
At 106 nanoseconds per element the chase isn’t really running a program any more, it’s just paying full memory latency, one element at a time, four million times in a row.
The same thing shows up as a working-set sweep. Below is time per element as the data grows, for the contiguous walk, the shuffled pointer walk and the chase:
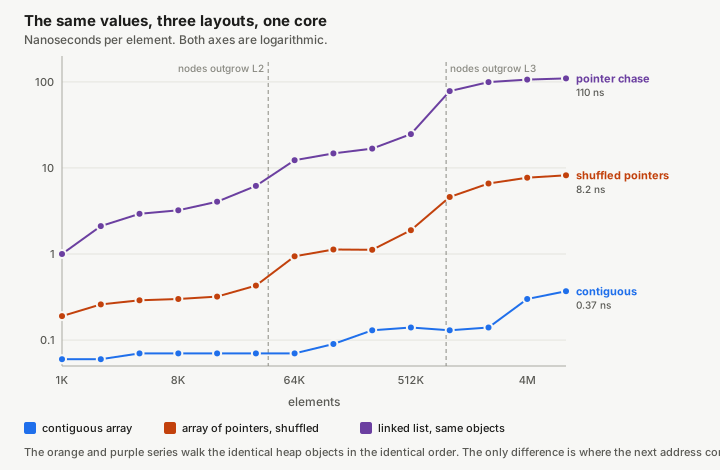
The contiguous line is essentially flat — 0.06 ns/element in L1 and 0.37 out in DRAM, because a streaming read is bandwidth work and the prefetcher hides the latency completely. The chase climbs the entire memory hierarchy, from 1 ns when the nodes fit in L1 to 110 ns when they don’t fit anywhere, a 110× spread from nothing but working set. Its cliff at around a million elements is where 32 MB of nodes stops fitting in this chip’s 30 MiB L3, which is a satisfying way to confirm the allocator really is giving each 16 byte node a 32 byte slot.
Two notes on generality. First, this is a 12th generation part, and it has no prefetcher that reads pointer values. Some newer hardware does — Apple silicon and Intel’s 13th generation both ship a data-dependent prefetcher that will speculatively follow a pointer it finds in a cache line, which claws back some of this and caused a memorably nasty side-channel attack along the way.4 Second, the chase is a deliberate worst case: it is one unbroken chain with no other work in it. Real code usually has something else to get on with, which is exactly what lets the core cover some of the latency.
Why the array didn’t help#
Back to Python, and to the row that started all this. Here is the whole ladder:
# sum() over a list, allocation order      10.04 ms
# sum() over a list, shuffled              74.87 ms
# sum() over array('q')                    19.23 ms
# sum() over an ndarray                    61.32 ms
# ndarray.sum()                             0.24 ms
An array('q') stores two million integers as sixteen megabytes of contiguous machine words. No pointers,
no headers, no scatter. By every argument in this post so far it should win, and it loses to the list by a
factor of two.
It loses because of what happens on the way out. There is no such thing as a raw machine integer in Python.
The moment you index an array('q'), the interpreter has to build a PyLongObject to hand you — so
iterating it allocates and destroys two million integer objects, one per element. You removed the indirection
from storage and paid for it again at the boundary, plus an allocation. The ndarray row is the same
mistake and worse, because a boxed np.int64 is a heavier object than an int.
And then ndarray.sum(), which is forty-two times faster than the ordered list and three hundred times
faster than the shuffled one. Nothing about the layout changed between the last two rows. What changed is
that the loop moved: it now runs inside NumPy, over the same contiguous buffer, without ever constructing an
object. Contiguous, no indirection, no per-element allocation, and — because it’s a flat array of a known
type with no dependencies between iterations — free to be vectorised and to have as many loads in flight as
the hardware will allow.
Which is the point I actually want to make. “Use an array instead of a list” is a rule, and this is what rules do at their edges: a compact layout is worth nothing on its own. It is worth something when whatever consumes it can do so without rebuilding, one element at a time, precisely the indirection you removed. Two rows of that table follow the rule and lose. The mechanism tells you which is which and the rule cannot.
When pointers are the right answer#
I don’t want to leave this sounding like pointers are a mistake, because they obviously aren’t. A few cases where the analysis comes out the other way:
When it all fits in cache. Every number in this post is a story about DRAM. At a thousand elements the chase costs 1 ns per element, and the difference between layouts is a rounding error. Most collections are small, and small means free.
When you need the addresses to stay put. A Vec moves its contents when it grows. If other things hold
references to your objects, or you’re splicing in the middle of a long sequence, indirection is buying you
something real and you should pay for it knowingly.
When you can shorten the chain instead of removing it. This is the interesting one. A binary search tree over a million items is twenty dependent loads, one per level, each one a full memory round trip; twenty times 80 nanoseconds and no overlap available. A B-tree over the same million items is three or four levels, because each node is sized to fill cache lines and holds many keys. It isn’t faster because it uses less memory — it often uses more. It’s faster because the search is four serial round trips instead of twenty, and the linear scan within each node is exactly the kind of independent work the core can do sixteen at a time. Same data, same asymptotics, a fifth of the dependent chain.
And the middle road, which is what most performance-minded code ends up doing: keep the objects in one contiguous arena and refer to them by index rather than by pointer. The indices are integers you can compute, so the address is known without a load, and you get to keep your graph.
Conclusion#
Three posts of this series have now been about the cache line: how much of it arrives per fetch, and which core owns it. This one was about something that isn’t about size at all. A load cannot begin until its address is known. When the address is a number you can compute, the core will start a dozen loads before the first one returns. When the address is a value you have to fetch, it can start exactly one, and it will spend around 80 nanoseconds finding out where to go next.
That single fact accounts for the whole spread here: 0.30 nanoseconds per element for a contiguous walk and 106 for a chase through the same values, a factor of three hundred and fifty, with the same instruction count and no algorithmic difference whatsoever.
It also accounts for the two Python results I opened with, which look like separate curiosities and are the
same story twice. Shuffling a list is slow because the addresses become unpredictable. array('q') is slow
because removing indirection from storage doesn’t help if you reintroduce it, plus an allocation, on every
element you read out.
Next time I want to stay with dependency but drop the memory entirely. Take a loop that adds up an array — contiguous, prefetched, perfectly behaved, nothing to wait for — and it will still run at a fraction of the speed the core is capable of, for the same reason a chase does: everything is waiting on the thing before it. One accumulator is a bottleneck, and splitting it into several turns out to be free money.
The benchmarks, the Python script and the instructions to reproduce all of this are in the repo for this blog. Your numbers will be different. That’s rather the point.
Which is also why
a is bisTruefor small integers andFalsefor large ones, a fact that usually turns up in an interview question rather than in a benchmark. ↩︎A permutation used as a mapping would decompose into several short cycles, and a chase built from one would silently traverse a fraction of the data and look extremely fast. Reading it as a visit order instead — link each element to the one after it, wrap the last to the first — always gives a single cycle. There’s a test for it, because I don’t trust myself on this. ↩︎
Every Rust loop here accumulates into a total that gets handed to
black_box. Without it LLVM notices the sum is unused, deletes the traversal, and reports a very impressive benchmark. Part two of this series was nearly published with that mistake in it. ↩︎The i9-12900K used here is Alder Lake, which has no such prefetcher, so these numbers are the clean case. If you run this on an M-series Mac and get a smaller ratio, that’s likely why. ↩︎