Part one of this series had one central fact and one piece of advice. The fact was that memory moves in 64 byte cache lines, so the cost of a loop is the number of lines it touches. The advice that fell out of it was to pack your data tightly, because packing more useful bytes into each line means fetching fewer lines.
This post is about a case where packing tightly is the entire bug, and the fix is to deliberately waste 56 bytes out of every 64.
Both of those follow from the same fact. That is the reason I keep going on about mechanisms rather than rules: here are two pieces of advice that flatly contradict each other, and the only way to know which one you are looking at is to know why either was ever true.
Here is where we’re going. I take a loop that sums some numbers, split it across eight cores, and it becomes fourteen times slower than not threading it at all.
The line is also a unit of ownership#
Parts one and two were both about a single core talking to its own caches. Once you have more than one core, each with its own L1 and L2, you have a problem those posts didn’t: two cores can hold copies of the same memory, and something has to stop them disagreeing.
That something is a cache coherence protocol. The details vary, but the part that matters is a single rule:
Before a core can write to a cache line, it must hold that line exclusively. Every other core has to give up its copy first.
Note the granularity. Not “before a core can write to a byte”. The line. All 64 bytes of it, because the line is the smallest thing the coherence machinery knows how to talk about, exactly as it was the smallest thing the memory system knew how to fetch in part one.
So picture two threads, each incrementing its own private counter, and those two counters happen to sit eight bytes apart:
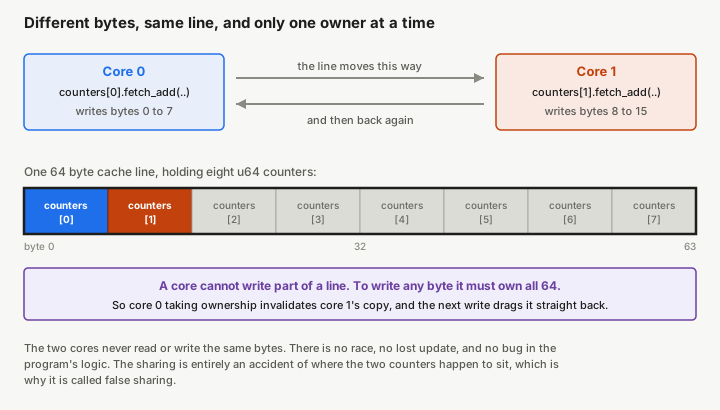
Core 0 wants to write counters[0], so it takes exclusive ownership of the line, which invalidates core 1’s
copy. Core 1 then wants to write counters[1], so it takes exclusive ownership back, invalidating core 0’s.
Repeat, once per increment, forever.
The two threads never touch the same bytes. There is no race, nothing is lost, and the program’s output is perfectly correct. The contention is purely an accident of the two counters’ addresses. That is why it’s called false sharing: the sharing isn’t real, but the cost certainly is.
The obvious parallel sum#
Let’s write the code you’d actually write. I’m reusing part one’s weather readings, and the job is to total the temperature field. Each thread takes a slice and keeps a running total in its own slot:
let counters: Vec<AtomicU64> = (0..threads).map(|_| AtomicU64::new(0)).collect();

// ... one of these per thread ...
for r in slice {
    counters[tid].fetch_add(r.temperature as u64, Ordering::Relaxed);
}
That looks entirely reasonable. Every thread owns its own counter, nothing is shared, the ordering is
Relaxed because we only care about the final total. A Vec<AtomicU64> of per-thread statistics is a
thoroughly ordinary thing to find in a codebase.
It is also eight 8-byte counters laid out consecutively, which is to say 64 bytes, which is to say one cache line.1
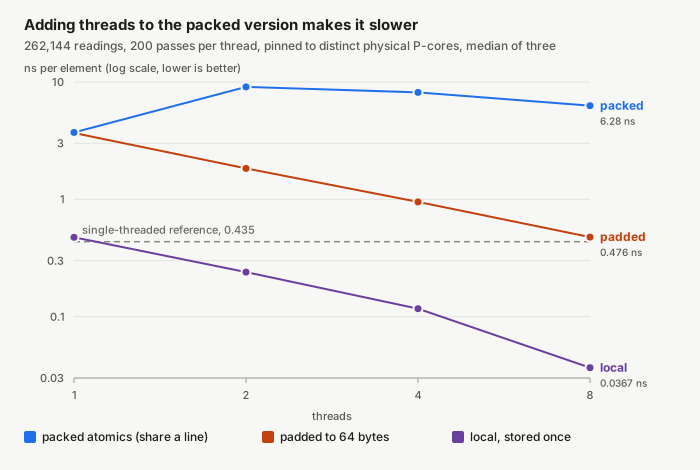
Here is what happens when you add threads, against the two fixes we’ll get to shortly. Every thread is pinned to its own physical core, which matters more than you’d think.2 Note the log scale:
| threads | packed | padded | local |
|---|---|---|---|
| 1 | 3.72 | 3.68 | 0.474 |
| 2 | 9.07 | 1.83 | 0.240 |
| 4 | 8.15 | 0.951 | 0.117 |
| 8 | 6.28 | 0.476 | 0.0367 |
Single-threaded, for reference: 0.435 ns per element.
Read the first column downwards. Going from one thread to two makes it two and a half times slower. It never recovers, and at eight threads it is still 14 times slower than the single-threaded version that does all the work on one core. Eight cores, and we have gone backwards.
Notice also that at one thread the packed and padded versions are identical, 3.72 against 3.68. With a single thread there is nobody to fight with, so the whole effect vanishes. Whatever this is, it only exists in the presence of other cores.
Asking the hardware where it hurts#
I could tell you this is false sharing and you’d have to take my word for it. Instead, here is the hardware
being asked directly. perf on this CPU exposes a counter called
mem_load_l3_hit_retired.xsnp_hitm, which counts loads that were served by a modified line sitting in
another core’s cache. That is precisely the signature we’re looking for: data being dragged sideways between
cores.
| variant | cycles | xsnp_hitm |
|---|---|---|
| single-threaded | 264,524,283 | 1,642 |
| packed | 10,833,236,097 | 13,005,540 |
| padded | 1,074,080,959 | 10,135 |
| local | 239,660,798 | 8,732 |
The packed version has 1,283 times the cross-core traffic of the padded one. Everything else is at noise level.
Better still, there is a tool built for exactly this. perf c2c (for cache-to-cache) records where lines are
being passed between cores and then tells you which line:
$ perf c2c record -- ./target/release/counters shared 8 60
$ perf c2c report --stdio
Total records : 2598
Locked Load/Store Operations : 2408
Load Local HITM : 297
Total Shared Cache Lines : 2
Locked Access on shared lines : 2405Two shared cache lines, and essentially every locked operation in the program is happening on them. It goes further and breaks the line down by offset, which is where it gets satisfying:
| cache line | counters on it | offsets within the line |
|---|---|---|
0x…5f00 | 6 | 0x0, 0x8, 0x10, 0x18, 0x20, 0x28 |
0x…5ec0 | 2 | 0x30, 0x38 |
Eight counters, eight bytes apart, and perf c2c has found all of them and grouped them by the line they
landed on. It also caught something I hadn’t thought about: the counters straddle a line boundary. A
Vec is only 8 byte aligned, so my eight counters don’t sit neatly inside one line, they spill across two,
six in one and two in the other. The line holding six takes 94% of the contention. I went back and asserted
this in the test suite afterwards, because it is a detail I would have got wrong if I had only reasoned about
it.
If you take one tool away from this post, take perf c2c. It answers “which of my data structures is doing
this” without any guessing.
Two fixes, and only one of them is good#
The textbook fix is to force each counter onto its own line. In Rust that’s an alignment attribute:
#[repr(align(64))]
struct Padded(AtomicU64);
align(64) pushes both the size and the array stride up to 64 bytes, so no two counters can land on the same
line. Fifty-six of every 64 bytes are never read. Look back at the table: this takes eight threads from 6.28 ns
to 0.476 ns, thirteen times faster, and turns that negative scaling curve into a nearly straight line, each
doubling of threads roughly halving the time.
It also proves the mechanism beyond argument. Same instructions, same atomics, same access pattern, same number of threads. The only change is 56 bytes of nothing between the counters.
But look again at the padded column and the single-threaded reference. Eight cores, false sharing fully fixed, and we have got to 0.476 ns against 0.435 ns for one core doing everything. We have spent eight cores to be very slightly slower than one. Padding fixed false sharing without fixing the design.
The problem is that we are still doing an atomic read-modify-write per element, and a locked operation costs something like twenty cycles even when nobody is contending it. So don’t do it per element:
let mut local = 0u64;
for r in slice {
    local = local.wrapping_add(r.temperature as u64);
}
counters[tid].store(local, Ordering::Relaxed);
Accumulate in a local variable, which lives in a register, and touch the shared line exactly once at the end.
That’s the local column: 0.0367 ns at eight threads, 171 times faster than the packed version and twelve
times faster than one core. And notice that it doesn’t need the padding at all, because it barely touches the
shared array.
That is the honest ordering of these fixes. Padding is the demonstration. Not sharing is the fix.
Reading together is free#
It’s easy to over-learn this and conclude that threads touching the same cache line is bad. It isn’t. Go back to the rule: a core needs exclusive ownership to write. Reading is different. Any number of cores can hold the same line read-only at the same time, and nobody has to give anything up.
So I ran a version where all eight threads read one shared value on every single iteration and write nothing to it. If sharing were the problem, this should be terrible:
| threads | 1 | 2 | 4 | 8 |
|---|---|---|---|---|
| read-only, ns per element | 0.667 | 0.336 | 0.164 | 0.0722 |
Nine times faster on eight threads, near enough linear, and its xsnp_hitm count is 15,873, which is the same
noise floor as the single-threaded run. Eight cores hammering one cache line, and it costs nothing at all.
Shared immutable data is fine. Shared written data is what costs.
When the sharing is real#
One more case, to mark the boundary of what padding can do. Everything above is false sharing: the threads had no logical need to share anything, and we fixed it by rearranging memory. What if they genuinely do share?
// One counter. Every thread adds to it.
counter.fetch_add(r.temperature as u64, Ordering::Relaxed);| threads | 1 | 2 | 4 | 8 |
|---|---|---|---|---|
| one shared atomic, ns per element | 3.70 | 7.23 | 9.25 | 8.36 |
Same shape as the packed version, and just as bad. But there is no padding you can add, because there is only
one counter and the contention is the point. Its xsnp_hitm count is 13,972,092, near-identical to the packed
case, so the hardware is doing exactly the same work.
The distinction matters because it tells you which fix you need. False sharing is an accident of layout and you
solve it with layout. True sharing is a property of your algorithm, and you solve it by changing the algorithm:
per-thread partial results combined at the end, which is the local version again.
The GIL was hiding this from you#
If you write Python, you may reasonably feel this doesn’t apply to you, and until recently you’d have been right. Under the global interpreter lock only one thread executes bytecode at a time, so two threads can’t write the same cache line concurrently, because they can’t do anything concurrently. The hazard doesn’t exist.
That changed. PEP 779 moved the free-threaded build of CPython from experimental to officially supported in 3.14. It’s still opt-in, but it’s real, and it means Python-level threads now run at the same time on different cores.
So here is the same experiment in Python, on the same machine. Eight threads, two million increments each,
accumulating into an array('q') so the slots are genuinely adjacent 8-byte integers.3 The
packed and padded versions are byte-identical code; the only difference is whether the slots are 8 bytes
apart or 64:
acc = array('q', [0] * threads)        # packed: 8 counters, one cache line
acc = array('q', [0] * threads * 8)    # padded: stride 8 slots, one line each

def worker(acc, slot, iters):
    for _ in range(iters):
acc[slot] += 1| build | packed | padded | speedup from padding |
|---|---|---|---|
| 3.14 (with the GIL) | 31.66 ns | 31.62 ns | 1.00x |
| 3.14t (free-threaded) | 30.41 ns | 4.80 ns | 6.33x |
Under the GIL, moving the counters apart is worth exactly nothing, and that’s not a rounding artefact, it came out 1.00x on every run. The optimisation is meaningless because the problem cannot occur. Free-threaded, the identical change is worth 6.3x.
Now read that table the other way, which I think is the more useful direction. Suppose you port this code to free-threaded Python to get parallelism across eight cores. With the packed counters you go from 31.66 ns to 30.41 ns: a 4% improvement for eight cores. Cache line contention ate the entire benefit. Move the counters 64 bytes apart and the same port is worth 6.6x. Accumulate in a local and it’s 21x.
This is the thing I’d want a Python programmer to take from the whole series. Free-threading doesn’t hand you parallelism, it hands you permission to have parallelism, and whether you actually get any depends on questions about memory layout that the GIL let you ignore for thirty years. Meanwhile NumPy and BLAS have been spawning native threads underneath you the entire time, which is why this was always reachable, just not from code you wrote.
Conclusion#
We started with a loop that got fourteen times slower when we spread it across eight cores, and the reason turned out to be that a core cannot write one byte of a cache line without taking all 64 for itself. Eight per-thread counters packed into one line meant eight cores passing that line between them, once per increment.
The fixes came out in an order I found genuinely instructive. Padding each counter onto its own line is worth 13x and proves the mechanism, but leaves you with eight cores performing slightly worse than one. Accumulating in a local and writing once is worth 171x, and makes the padding irrelevant. The interesting fix wasn’t the clever one.
Then the two boundaries. Eight threads reading one line cost nothing measurable, so it is writing, not sharing, that hurts. And one genuinely shared counter is just as slow as the accidental case, but no amount of padding will save it, because that contention is in the algorithm rather than the layout.
Set this next to part one and you have the reason I write these. Part one said pack your data tightly. This post says pad it apart. Both are correct, both come from the same 64 byte line, and a rule cannot tell you which one you need. The mechanism can.
Next time I’d like to pick up something I have only mentioned in a footnote: why is a Python list slower
than an array("q"), an np.ndarray or Rust’s Vec? I will be going beyond the standard
“interpreters are slow” story and, using the skills we’ve developed over the last few posts, analyse the
memory layout of our datastructures, with a few twists. The main one being that when your data is a graph of
pointers, the machine cannot even begin to look for the next value until it has finished waiting for this
one.
The benchmark, the Python script and the instructions to reproduce all of this are in the repo for this blog. Your numbers will be different. That’s rather the point.
Or nearly. It turns out a
Vecis only 8 byte aligned, so the eight counters straddle a boundary and land six on one line and two on the next, which is whatperf c2creported above. They cannot possibly get a line each, which is all the bug requires. ↩︎Every measurement here pins each thread to a distinct physical core: CPUs 0, 2, 4 and so on, because on this machine CPUs 0 and 1 are two hyperthreads of one physical core sharing an L1 and an L2. Running eight threads on 0-7 instead of 0, 2, 4 … 14 gives you four physical cores’ worth of throughput and moves the numbers by two to three times. If you benchmark this without pinning, you are measuring the scheduler’s choices as much as your own. ↩︎
A Python
listwould be no good here. It holds pointers to boxed integer objects scattered across the heap, so adjacent list slots tell you nothing about adjacent memory. Also worth noting: thelocalvariant in my Python results avoids array indexing as well as sharing, so part of its win is interpreter overhead rather than coherence. The controlled comparison is packed against padded, which differ only in stride. ↩︎