I’ve been putting together a talk about the things I don’t worry about, because NumPy does them for me:
the performance patterns I kept running into over seven years of reviewing NumPy code written by people far
smarter than me. What an array actually is. When reshape quietly copies six gigabytes. What broadcasting
promises not to allocate. I did a practice run of it at SydPy recently.
The NumPy-specific parts landed fine. Then I got to a slide which says that a copy isn’t slow because the CPU is busy, it’s slow because the bytes have to physically move; that main memory will only hand them over at something like 20 GB/s; and that while that’s happening your cache is filling up with data you will never look at again.
The room went blank.
Not confused-blank. Polite-blank. The particular look people give you when you’ve clearly just delivered something that was meant to be the punchline, and they can’t see the joke.
I’ve been chewing on that ever since, because it wasn’t the audience’s fault. These were experienced engineers, several of whom write more Python in a week than I do. The problem is that we teach performance as a list of rules. Vectorise your loops. Don’t copy. Use the library function. They’re good rules, and they’re right almost all of the time. But we rarely teach the layer the rules come from, so they end up being folklore, and folklore is no help at all the moment you hit a case it doesn’t cover. Worse, you can’t tell the difference between a rule that still applies and one that doesn’t, because you never knew why it was a rule.
So this post is the thing I wish I could have assumed that evening. It’s the first in a series on mechanical sympathy, and I’m going to build it out of the oldest trick in the data-oriented design playbook: array of structs versus struct of arrays.
Here’s where we’re going. Two programs, holding the same data, computing the same number, getting the same answer. One of them is eleven times faster than the other. Nothing is cached, nothing is parallelised, no clever algorithm gets swapped in. I just move the bytes around.
One warning before we start: the code below is Rust, not Python. That’s deliberate, and it isn’t because I think you should go and rewrite anything. It’s because Rust lets me put the memory layout directly in the source where you can see it, and lets me show you the machine code at the end. Every idea in here applies exactly as much to the NumPy array you had in mind. We’ll come back to that at the end, and it’ll turn out you’ve been relying on all of this for years.
What is mechanical sympathy?#
The phrase comes from Jackie Stewart, the Formula One driver, who reckoned you didn’t have to be an engineer to drive a car well, but you did have to have a feel for what the machine wanted. Push it the way it wants to go and it rewards you. Fight it and it fights back.
Martin Thompson borrowed the phrase for software, and it stuck. Martin Fowler has written about the principles, and Vicki Boykis has a lovely piece on what it means when so much of our work sits on top of layer after layer of abstraction.
Here’s the version I care about. Your programming language tells you that memory is a big, flat, uniform array of bytes, and that reading any one of them costs the same as reading any other. That is a lie. It’s a useful lie, it’s the reason we can get anything done at all, and for most of the code you write it doesn’t matter.
But it’s still a lie, and it has a price. Mechanical sympathy is just knowing where the lie is.
The machine you actually have#
Everything in this post rests on one fact, so let’s get it out of the way.
Your CPU does not read bytes from memory. It reads cache lines.
A cache line on essentially every modern x86 machine is 64 bytes. If you ask for a single byte, the hardware fetches all 64 bytes surrounding it and parks them in cache. If you ask for the next byte along, it’s already there and the read is nearly free. If you ask for a byte 400 bytes away, that’s another line, another trip.
Why does it work like that? Because memory is slow, and it’s slow in a way that’s easy to underestimate. Here’s the machine I’m writing this on, a 12th Gen Intel Core i9-12900K:
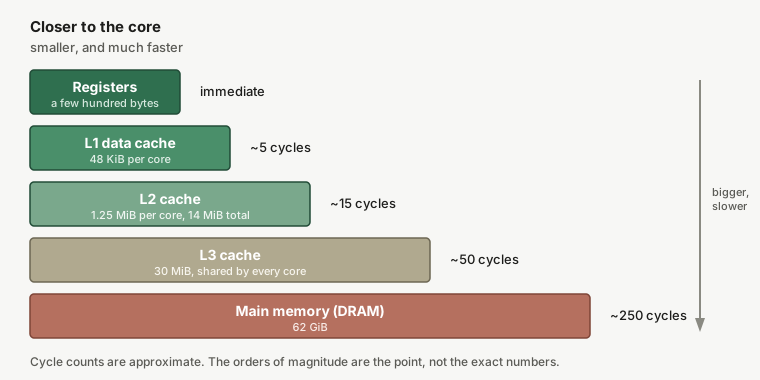
Look at the bottom two rows. Getting a value from L1 costs about 5 cycles. Getting it from main memory costs something like 250. That’s not 5% slower, or twice as slow. It’s fifty times slower, and while it happens your beautifully optimised loop is sitting on its hands doing nothing at all.
So the caches exist to stop that happening, and they work by betting on you. The bet is: if you touched this byte, you’ll want its neighbours shortly. Programs that make that bet pay off run fast. Programs that don’t, don’t.
Which means the real currency isn’t how many bytes your program needs. It’s how many cache lines your program touches. Keep that in your head and the rest of this post is arithmetic.
Two ways to store the same data#
Let’s make it concrete. Say we’re collecting readings from a network of weather stations. In Rust, the obvious way to model a reading is a struct:
#[derive(Clone, Copy)]
pub struct Reading {
    pub timestamp: u64,
    pub station_id: u32,
    pub temperature: i32,
    pub humidity: f32,
    pub pressure: f32,
    pub wind_speed: f32,
    pub rainfall: f32,
}
That’s 8 bytes for the timestamp and 4 for each of the other six fields, which comes to exactly 32.1 Then you collect a pile of them:
let readings: Vec<Reading> = load_readings();This is an array of structs, or AoS. It’s what every language and every tutorial nudges you towards, and I want to be clear that it is a completely reasonable thing to write. One reading is one thing in the world, so one reading is one object in the program. That’s good modelling.
The alternative feels wrong the first time you see it. Instead of one array of readings, you keep one array per field:
#[derive(Default)]
pub struct Readings {
    pub timestamp: Vec<u64>,
    pub station_id: Vec<u32>,
    pub temperature: Vec<i32>,
    pub humidity: Vec<f32>,
    pub pressure: Vec<f32>,
    pub wind_speed: Vec<f32>,
    pub rainfall: Vec<f32>,
}
This is a struct of arrays, or SoA. Reading number 7 is no longer one object anywhere. It’s
timestamp[7], temperature[7], humidity[7] and so on, scattered across seven different arrays, held
together by nothing but an index and your good intentions.
It’s worse code by most of the measures we normally use. So why would anyone do it?
Counting the cost before we measure#
Because of the question we want to ask. Ours is going to be about as simple as it gets: what is the total of all the temperatures?
pub fn total_temperature_aos(readings: &[Reading]) -> i64 {
    let mut total: i64 = 0;
    for reading in readings {
        total += reading.temperature as i64;
    }
    total
}
We only ever touch temperature. That’s 4 bytes out of every 32. Here’s what those 32 bytes look like
sitting in memory, with the cache lines drawn on:
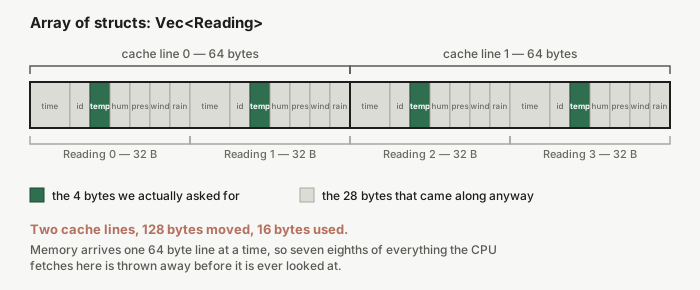
The green cells are what we asked for. The grey cells are what turned up anyway, because they were on the same cache line, and there is no mechanism by which we could have declined them.
Now the struct of arrays version:
pub fn total_temperature_soa(readings: &Readings) -> i64 {
    let mut total: i64 = 0;
    for &temperature in &readings.temperature {
        total += temperature as i64;
    }
    total
}
Same data, same answer. But readings.temperature is a contiguous run of 4-byte integers and nothing else,
so a cache line holds sixteen of them, all of which we want:
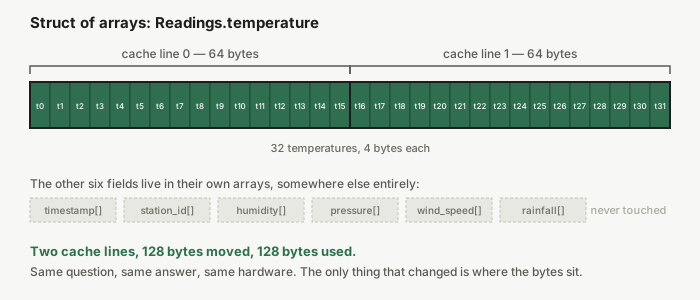
So here’s a prediction we can actually check. To total a million temperatures, AoS drags 32 MB across the memory bus and uses 4 MB of it. SoA moves 4 MB and uses 4 MB. Eight times less traffic, so SoA should be somewhere in the region of eight times faster.
A quick quiz before we run it: do you think that 8x will hold no matter how many readings we have? Have a guess. I got this wrong.
Measuring#
I’ve set up a benchmark with criterion, sweeping the number of readings so the data walks down through the cache hierarchy. Everything is pinned to a single performance core, because the 12900K mixes fast and slow cores and unpinned numbers on a chip like that are worthless.2
$ RUSTFLAGS="-C target-cpu=native" taskset -c 2 cargo benchtotal_temperature/aos/16000000
time: [19.438 ms 19.520 ms 19.610 ms]
thrpt: [3.0396 GiB/s 3.0535 GiB/s 3.0663 GiB/s]
total_temperature/soa/16000000
time: [3.3274 ms 3.3503 ms 3.3780 ms]
thrpt: [17.645 GiB/s 17.791 GiB/s 17.914 GiB/s]Here’s the whole sweep. The middle column of each estimate is what I’ve tabulated:
| Readings | AoS footprint | SoA footprint | AoS | SoA | Speedup |
|---|---|---|---|---|---|
| 1 000 | 32 KB | 4 KB | 133.0 ns | 50.5 ns | 2.6x |
| 100 000 | 3.2 MB | 400 KB | 34.70 µs | 4.97 µs | 7.0x |
| 1 000 000 | 32 MB | 4 MB | 720.8 µs | 65.8 µs | 11.0x |
| 16 000 000 | 512 MB | 64 MB | 19.52 ms | 3.35 ms | 5.8x |
SoA wins everywhere. But that 8x prediction? It’s only ever approximately right, and the shape of the error is the interesting part. Let’s go through it row by row, because each row is a different story.
1 000 readings, 2.6x. The entire AoS array is 32 KB, which fits inside this core’s 48 KiB L1 cache. There are essentially no cache misses to avoid. The whole cache-line argument I just spent a thousand words on simply does not apply here, and yet SoA is still more than twice as fast. Hold that thought, we’ll come back to it.
100 000 readings, 7.0x. Now we’re cooking. 3.2 MB overflows the 1.25 MB L2 cache, so AoS is going out to L3 constantly, while SoA’s 400 KB sits comfortably in L2. This is the predicted effect, more or less on the nose.
1 000 000 readings, 11.0x. This is the peak, and it beats the prediction. Why? 32 MB of AoS just overflows this chip’s 30 MB L3, so it’s spilling to main memory. SoA’s 4 MB fits in L3 with room to spare. The gap here isn’t only that SoA moves fewer bytes. It’s that moving fewer bytes kept the working set small enough to live in an entirely faster level of the hierarchy. That’s the bigger prize, and it’s the one I didn’t predict.
16 000 000 readings, 5.8x. And now the gap narrows. Both layouts have blown past every cache, both are being fed from DRAM, and neither gets to be clever any more. AoS is pulling 26 GB/s off main memory, SoA 19 GB/s, and at that point a single core is near the limit of what it can drag out of RAM regardless of how tidily you asked. The advantage doesn’t vanish, but the free lunch of “fit in a faster cache” is gone.
The lesson I take from that table is not “SoA is 8x faster”. It’s that the benefit depends entirely on where your data sits relative to the caches, which is exactly the thing you cannot see from the source code.
What the compiler did#
Back to that first row. 1 000 readings, everything in L1, no misses worth mentioning, and SoA still wins 2.6x. Cache lines can’t explain that, so something else is going on. Let’s look at what the compiler actually emitted.
$ RUSTFLAGS="-C target-cpu=native" cargo rustc --release --lib -- --emit asmThe SoA inner loop:
.LBB3_11:
	vpmovsxdq	(%rdx,%rax,4), %ymm4
	vpaddq	%ymm4, %ymm0, %ymm0
	vpmovsxdq	16(%rdx,%rax,4), %ymm4
	vpaddq	%ymm4, %ymm1, %ymm1
	vpmovsxdq	32(%rdx,%rax,4), %ymm4
	vpaddq	%ymm4, %ymm2, %ymm2
	vpmovsxdq	48(%rdx,%rax,4), %ymm4
	vpaddq	%ymm4, %ymm3, %ymm3
	addq	$16, %rax
	cmpq	%rax, %r8
	jne	.LBB3_11
You don’t need to read x86 fluently to see the shape of this. Each vpmovsxdq grabs four consecutive
integers straight out of memory and widens them, each vpaddq adds four numbers at once, and there are four
pairs of them. That’s sixteen temperatures per trip round the loop, in eleven instructions, and sixteen
temperatures is exactly one 64 byte cache line. The loop consumes one line per iteration and wastes nothing.
This is SIMD: one instruction, several pieces of data. The compiler did it for us, without being asked, because the data was laid out in a way that made it possible.
Now the AoS loop:
.LBB2_11:
	vpcmpeqd	%xmm5, %xmm5, %xmm5
	vpxor	%xmm6, %xmm6, %xmm6
	vpgatherdd	%xmm5, 12(%rbx,%xmm1), %xmm6
	vpcmpeqd	%xmm5, %xmm5, %xmm5
	vpxor	%xmm7, %xmm7, %xmm7
	vpgatherdd	%xmm5, 140(%rbx,%xmm1), %xmm7
	...
	vpmovsxdq	%xmm6, %ymm5
	vpaddq	%ymm5, %ymm0, %ymm0
	...
	addq	$512, %rbx
I’ll admit I expected this one to be plain, boring, one-at-a-time scalar code. It isn’t. The compiler tried
hard. vpgatherdd is a gather instruction: it takes a vector of addresses and fetches from all of them at
once, which is how you vectorise a loop over data that isn’t contiguous. LLVM reached for it so it could keep
adding four at a time even with 32 bytes between each value it wanted.
And it still loses badly, for two reasons. The first is that addq $512, %rbx at the bottom: this loop
advances 512 bytes per iteration to collect the same sixteen temperatures the SoA loop got from 64 bytes.
Eight cache lines instead of one, exactly as predicted. The second is that gathers are genuinely slow
instructions. The hardware breaks each one apart internally and issues the loads more or less individually, so
you pay for the convenience.
That’s where the 2.6x on the L1-resident case comes from. Even when every byte is already in the fastest cache there is, the AoS loop needs far more instructions, and worse ones, to assemble the same sixteen numbers. The layout didn’t just cost us memory traffic. It cost us the good instructions.
Where this doesn’t help#
I’ve been stacking the deck, and it would be dishonest not to say where.
The whole result rests on us wanting one field across many records. Flip the question to “give me everything about reading number 400 000” and AoS wins outright: that’s one cache line, whereas SoA has to visit seven different arrays in seven different places. If your access pattern is record-at-a-time, keep your records together.
SoA is also awkward to maintain. Appending a reading means seven pushes that must not get out of step. There’s
no Reading to pass around, no type keeping the fields aligned with each other, and an off-by-one in one
array is a silent corruption rather than a compile error. Deleting from the middle is worse.
And the honest headline: for a few thousand readings, none of this matters. Look at the first row of that table again. We’re arguing over 80 nanoseconds. Write the clear thing, and reach for this when you’ve measured and found you need it.
The database people worked this out already#
Here’s the part I find genuinely delightful. If struct of arrays felt like a strange, niche trick when you first saw it, you have in fact been using it for years.
Store one array per field, contiguously, and you have just reinvented columnar storage. It’s why
Apache Parquet lays files out by column rather than by row. It’s what Apache Arrow holds
in memory. It’s why DuckDB and every other analytical database is built the way it is, and why they
leave row-oriented databases for dead on queries like SELECT avg(temperature) FROM readings, which is our
benchmark wearing a nicer suit.
It’s also why df['temperature'].mean() in pandas or polars is fast. That column is a contiguous array. The
loop underneath is the SoA loop, right down to the vpaddq.
None of those tools invented anything here. They just took the hardware seriously: if the questions you ask are about columns, store your data in columns. The layout follows from the question, not from the domain model.
And if you write NumPy, you have been on the winning side of this the entire time without being asked to think about it. A NumPy array is the struct-of-arrays column: one dtype, one contiguous buffer, no gaps. That’s the whole reason a C kernel can run flat out over it. You can even watch the trade-off happen if you go looking for it, because NumPy will let you build either layout:
# Array of structs: one record at a time, 32 bytes each.
aos = np.zeros(n, dtype=[('timestamp', 'u8'), ('station_id', 'u4'),
                         ('temperature', 'i4'), ('humidity', 'f4'),
                         ('pressure', 'f4'), ('wind_speed', 'f4'),
                         ('rainfall', 'f4')])
aos['temperature'].mean()   # strided: 4 bytes used per 32 fetched

# Struct of arrays: one array per field.
soa = {'temperature': np.zeros(n, 'i4'), 'humidity': np.zeros(n, 'f4')}
soa['temperature'].mean()   # contiguous: every byte earns its keep
Those two lines look equally idiomatic. They are not equally fast, and now you know precisely why. aos is a
structured array, so aos['temperature'] is a view with a stride of 32 bytes, and it drags
the whole diagram from earlier along with it:
aos.dtype.itemsize                        # 32, the same struct size as the Rust version

aos['temperature'].strides                # (32,) one whole record apart
aos['temperature'].flags['C_CONTIGUOUS']  # False

soa['temperature'].strides                # (4,) packed end to end
soa['temperature'].flags['C_CONTIGUOUS']  # True
That’s the same 32 bytes per record and the same 4 bytes wanted as the Rust version, which is not a coincidence. And it costs about the same, too. Summing 16 million temperatures on the same machine, pinned to the same core:
| Layout | Time |
|---|---|
| structured array (array of structs) | 25.49 ms |
| plain array (struct of arrays) | 5.00 ms |
5.1x, against the 5.8x that Rust got for the same question at the same size. Different language, different runtime, no compiler of mine involved. Same hardware, same cache lines, same answer.
So: check .strides when you want to know which layout you’ve actually got. Sixteen temperatures from one
cache line, or from eight.
Which is the actual thesis, and the reason I opened with the claim that I only moved bytes around. Your data layout isn’t an implementation detail hiding underneath your program. On a machine that reads 64 bytes at a time, sitting fifty cycles away from main memory, the layout is the program. Everything else is commentary.
Conclusion#
We started with two ways to store the same weather readings, and a claim that one was eleven times faster than the other. We’ve now seen why. Memory moves in 64 byte cache lines, so the cost of a loop is the number of lines it touches rather than the number of bytes it wants, and an array of structs touched eight lines to get what a struct of arrays got from one.
We measured it rather than assuming it, which was worth doing, because the tidy 8x prediction turned out to be wrong in both directions. It was too optimistic when everything fit in cache, too pessimistic when the smaller layout got to live in a faster cache entirely, and it collapsed back down once both layouts were stuck waiting on DRAM. Then we looked at the assembly and found a second effect hiding underneath the first: the contiguous layout got clean SIMD, and the strided one got stuck with gather instructions.
You won’t need this most days, and I want to be honest that almost none of my own code is written this way. But the habit underneath it is worth having: asking what the machine has to physically do in order to answer the question you asked it.
Which brings me back to that quiet room in Sydney. The slide that fell flat said the currency is bandwidth, not bytes, and I’d assumed that would land on its own. It won’t, and that’s fair enough, because it’s a conclusion and I’d skipped the argument. This post is the argument. If it worked, then “a copy isn’t slow because the CPU is busy, it’s slow because the bytes have to move” should now read as an obvious statement of fact rather than a riddle. That’s the whole gap I was trying to close.
The rest of the series carries on in the same direction. Next time I want to look at what happens when the CPU guesses which way a branch will go, and what it costs when it guesses wrong.
The benchmark, the assembly dumps and instructions to reproduce all of it are in the repo for this blog, if you’d like to run it on your own machine. Your numbers will be different. That’s rather the point.
You might wonder why
temperatureis ani32in hundredths of a degree rather than anf32. Partly because it’s how a lot of sensor hardware genuinely reports, but mostly because floating point addition isn’t associative, so a compiler isn’t allowed to reorder it and cannot auto-vectorise a sum of floats without being given explicit permission that Rust doesn’t expose on stable. Integer addition is associative, so it vectorises freely. That’s a mechanical sympathy story of its own, and one I’d like to come back to. ↩︎The 12900K has eight fast P-cores and eight slow E-cores, and the scheduler will happily shuffle your benchmark between them mid-run.
taskset -c 2pins it to one P-core. If you take one practical thing from this post, let it be that unpinned microbenchmarks on a hybrid CPU are measuring the scheduler, not your code. ↩︎